In the following graphs, the cellular response, as measured in real time by the concentration of a certain active effector protein, is plotted over time for five cell types (A to E) that are treated with three different concentrations of a signal molecule. During the time period indicated by the horizontal gray bar, the signal molecule is present in the culture media at a concentration of 1 nM (dotted curve), 5 nM (gray curve), or 25 nM (solid curve). Answer the following question(s) based on these graphs.
-Which of the cell types A to E shows the lowest sensitivity to the signal?
A)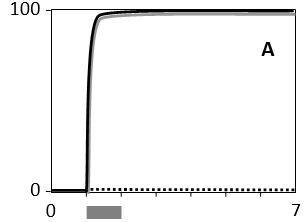
B)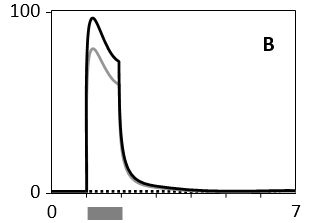
C)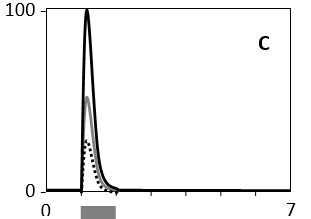
D)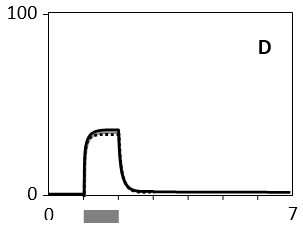
E)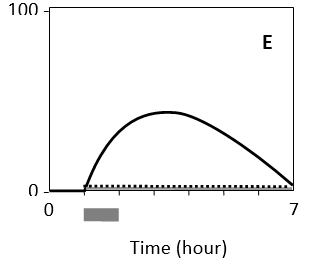
Definitions:
Federal Reserve System
The central banking system of the United States, responsible for monetary policy, regulating banks, and ensuring financial system stability.
Securities and Exchange Commission
A U.S. federal agency responsible for enforcing the laws governing the securities industry, and regulating the securities markets and investment companies.
Rate of Return
The advancement or decline in an investment's value over a predetermined interval, calculated as a percentage of the investment's initial expenditure.
Q13: Which of the following classes of noncoding
Q17: Keratins are intermediate filaments that ...<br>A) are
Q19: The homologous chromosome pairs in our cells
Q21: In the following pedigree, females and males
Q24: How has pathogenicity in pandemic strains of
Q25: Indicate whether each of the following descriptions
Q41: The RecA/Rad51 protein carries out strand exchange
Q42: In Drosophila melanogaster, loss-of-function mutations in either
Q47: You have used fluorescence-activated cell sorting to
Q94: A protein made from an expression vector