Short Answer
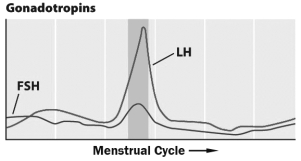
The graph below shows the levels of gonadotropins throughout the menstrual cycle.

The darker gray region of the graph corresponds to the period when __________ occurs in the ovaries.
Definitions:
Related Questions
Q10: Which of the following is not true?<br>A)
Q26: Any pathogens that macrophages find indigestible can
Q29: Insects breathe through a system of tubes,
Q32: The thyroid gland releases hormones that increase
Q35: Which one of the following methods of
Q40: Ostriches are huge nonflying birds that can
Q42: This figure depicts blood pressure in different
Q46: Different genetic versions of a particular pathogen
Q58: Actin filaments are anchored to<br>A) bones.<br>B) Z
Q60: Human females probably involved the ability to