Choose the one alternative that best completes the statement or answers the question.
-Use the following graph, which shows the types of incidents encountered with drivers using cell phones, to
find the probability that a randomly chosen incident involves cutting off a car. Round your answer to three
decimal places. 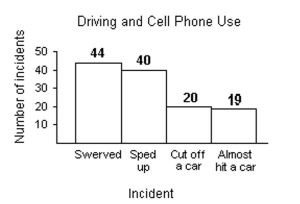
Definitions:
Regression Line
A line through a scatterplot of data points that best expresses the relationship between those points, typically used in linear regression to predict the outcome variable from the predictor variable.
Proficiency Test
An assessment designed to measure an individual's knowledge or competence in a specific area or discipline.
Prediction Interval
A range of values that is likely to contain the value of an unknown parameter for a future observation, with a certain degree of confidence.
Regression Analysis
A statistical technique that analyzes the connection between a dependent variable and one or more independent variables.
Q4: The number of ways 6 friends can
Q31: the colors of automobiles on a used
Q49: A survey of 280 homeless persons showed
Q51: Find the area under the standard normal
Q72: A coin is tossed 1000 times
Q87: Use the pie chart, which shows the
Q109: A local motel has 50 rooms. The
Q121: Data set: ages of 20 cars
Q158: A soda machine dispenses normally distributed amounts
Q162: <span class="ql-formula" data-value="f ( x ) =