Use the grouped data formulas to find the indicated mean or standard deviation.
-A random sample of 30 high school students is selected. Each student is asked how many hours he or she spent on the Internet during the previous week. The results are shown in the histogram. Estimate the sample
Mean. 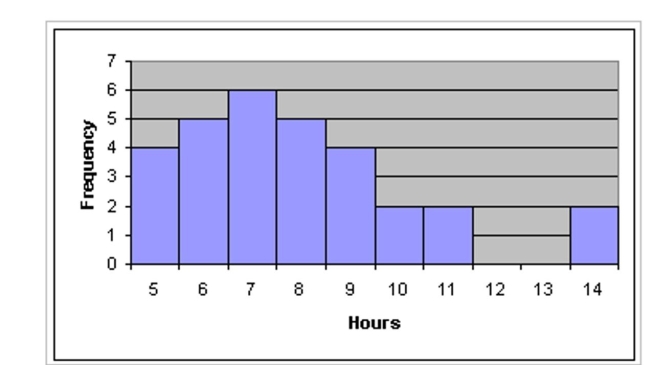
Definitions:
Q8: According to police sources, a car with
Q32: If you had to do a statistical
Q60: <span class="ql-formula" data-value="f ( x ) =
Q71: There is a relationship between smoking cigarettes
Q74: 0.3716<br>A)1.089331<br>B)0.425011<br>C)0.689630<br>D)2.352881
Q88: <span class="ql-formula" data-value="\ln ( x - 4
Q94: <span class="ql-formula" data-value="y = \log _ {
Q121: Data set: ages of 20 cars
Q128: The numbers of runs batted in
Q175: The function <span class="ql-formula" data-value="f