The computational procedure for homogeneity of proportions differs from that of the test of independence
in that it takes into account the standard deviation.
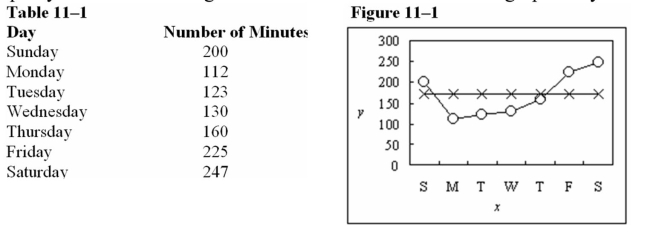
A sociologist wanted to determine whether there was a difference in the amount of time children aged 5-
7 spent watching television each day.Check the following data for evidence that the number of minutes
spent watching television is equally distributed throughout the week.The data is shown graphically in
Figure 11-1.Use 
Definitions:
Grape Pickers
Workers who manually or mechanically harvest grapes from vineyards.
Supply Curve
A graphical representation showing the relationship between the price of a good and the quantity of that good that suppliers are willing to offer for sale.
Supply
The overall quantity of a particular product or service that is accessible to buyers.
Demand
The desire and ability of consumers to purchase a good or service at a given price.
Q1: The critical value for a one-tailed right
Q5: If X is a normal random variable
Q34: A six-sided die is used to simulate
Q38: Dr.Christina Cuttleman, a nutritionist, claims that the
Q45: Which of the following is not a
Q46: An educational researcher is analyzing the test
Q47: A correlation coefficient of 0.96 would mean
Q55: The width of a confidence interval for
Q72: In a study comparing the systolic blood
Q79: For a normal distribution with mean -12