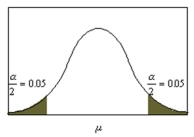
 Identify the confidence interval used in the figure below.
Definitions:
μ
A symbol representing the mean or average of a population in statistics.
≠ Symbol
Represents 'not equal to' in mathematical expressions, indicating that two values are not the same.
Null Hypothesis
A statement in hypothesis testing that assumes no significant difference or effect exists between certain measured phenomena or populations.
Directional
Pertaining to a hypothesis or test that specifies the expected direction of the relationship between variables.
Q4: A survey of 250 lobster fishermen found
Q6: Mrs.Smith's reading class can read a mean
Q15: A researcher tests three different brands of
Q22: <img src="https://d2lvgg3v3hfg70.cloudfront.net/TB8475/.jpg" alt=" A) inconsistent-no solution
Q44: The chi-square distribution is continuous, whereas the
Q70: One of the requirements for the z
Q75: The mean of {0, 7, 5, 3,
Q77: Using the normal distribution curve shown in
Q85: Many nonparametric tests involve _, or positioning
Q108: Sybil is having her yard landscaped. She