Multiple Choice
In the figure below, what is the area under the curve between z = 1.50 and z = 2.50? 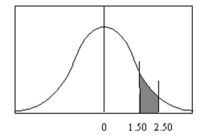
Definitions:
Related Questions
Q4: Graphs give a visual representation that enables
Q12: A time series graph represents data that
Q12: A random sample of 450 shoppers at
Q13: Which branch of statistics would employ probability
Q17: The campus bookstore asked a random set
Q34: A Pareto chart does not have which
Q45: A researcher is performing a two-way ANOVA
Q80: A lab technician is tested for her
Q94: All the values in a dataset are
Q134: 4x + y = 10 -4y +