Solve the problem.
-The following bar graph shows the average annual income for single mothers. 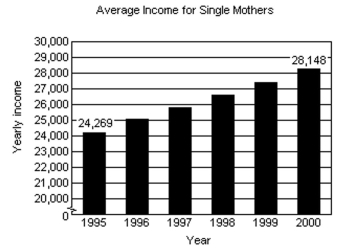 i) Determine a linear function that can be used to estimate the average yearly income for single mothers from 1995 through 2000. Let t represent the number of years from 1995. (In other words, 1995 corresponds to t = 0, 1996
Corresponds to t = 1, and so on.)
Ii) Using the function from part i, determine the average yearly income for single mothers in 1996.
Iii) Assuming this trend continues, determine the average yearly income for single mothers in 2010.
Iv) Assuming this trend continues, in which year will the average yearly income for single mothers reach $31,000?
Definitions:
Fathers Spend Less Time
The phenomenon where fathers engage in fewer hours of parenting or activities with their children compared to mothers.
Authoritarian
A governing or leadership style characterized by individual control and a lack of democratic participation.
Permissive
A parenting or leadership style characterized by offering considerable autonomy and few restrictions, often associated with high responsiveness and low demandingness.
Authoritative
Pertains to a leadership or parenting style marked by high expectations and supportiveness, leading to more independent and well-adjusted individuals.
Q14: A weatherman records the amount of rain
Q37: <img src="https://d2lvgg3v3hfg70.cloudfront.net/TB8475/.jpg" alt=" A)
Q50: The lower class limit represents the smallest
Q52: <img src="https://d2lvgg3v3hfg70.cloudfront.net/TB8475/.jpg" alt=" A) 84 B)
Q57: 30x + 10<br>A) 5(6x + 2)<br>B) 10(3x
Q75: The mean of {0, 7, 5, 3,
Q109: Through (5, 4) and parallel to the
Q186: Consider two numbers. One of the numbers
Q247: The voltage across a resistor is jointly
Q306: <img src="https://d2lvgg3v3hfg70.cloudfront.net/TB8475/.jpg" alt=" A) 1728 B)