Essay
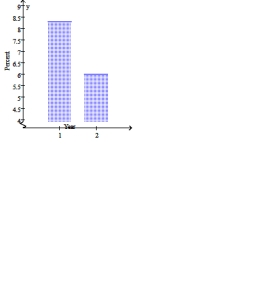
Draw a bar graph illustrating the change in a state's tax rate on each of the axes below. Note that
you'll be using the same information on each graph. 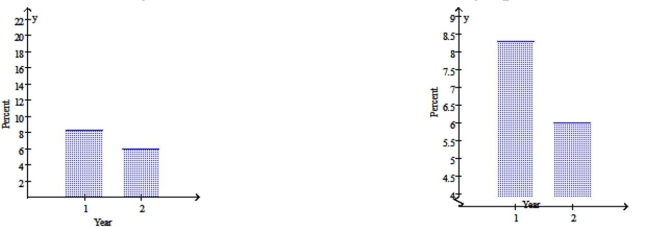
 \
\
Which of the two bar graphs would be used by someone wanting to argue that this tax cut won't hurt the state's
budget much? Why?
Definitions:
Related Questions
Q10: If two people are selected at random,
Q19: Use a preference table for the following
Q22: Use the system shown to find r
Q31: Use the system shown to find s
Q47: Let p = "I am hungry." Let
Q68: A box contains five blue, eight green,
Q85: Chromatic aberration occurs in a _ telescope
Q138: The star Vega has an apparent visual
Q153: These data represent the number of students
Q174: The exam grades of 31 students were