Essay
The graph of the following curve is given.Find the area that it encloses. 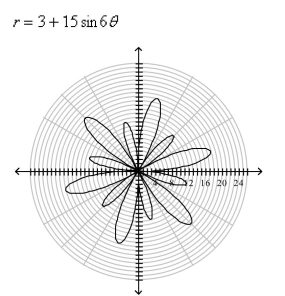
Definitions:
Related Questions
Q6: Use the result, "the line with intercepts
Q21: Use the limit process to find the
Q23: The orbit of Hale-Bopp comet, discovered in
Q29: The graph of <img src="https://d2lvgg3v3hfg70.cloudfront.net/TB8202/.jpg" alt="The graph
Q35: Write an equation of the line that
Q38: Find the slope of the graph of
Q42: Simplify the expression. <img src="https://d2lvgg3v3hfg70.cloudfront.net/TB8680/.jpg" alt="Simplify the
Q44: Evaluate (if possible) the function <img src="https://d2lvgg3v3hfg70.cloudfront.net/TB8202/.jpg"
Q71: Draw a rectangular box with the origin
Q104: Find the center and the radius of