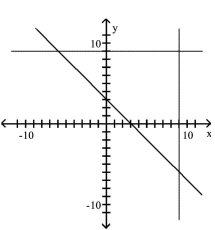
Write a system of linear inequalities that has the given graph.
-
Definitions:
Q3: <img src="https://d2lvgg3v3hfg70.cloudfront.net/TB8253/.jpg" alt=" A)0, multiplicity 1,
Q20: <img src="https://d2lvgg3v3hfg70.cloudfront.net/TB8253/.jpg" alt=" A)improper;
Q135: <img src="https://d2lvgg3v3hfg70.cloudfront.net/TB8253/.jpg" alt=" A)x = 4,
Q164: H(x)= <img src="https://d2lvgg3v3hfg70.cloudfront.net/TB8253/.jpg" alt="H(x)= A)
Q178: <img src="https://d2lvgg3v3hfg70.cloudfront.net/TB8253/.jpg" alt=" A){4} B){-4} C)
Q187: 7, -14, 28, -56, 112, ...<br>A) <img
Q198: A company manufactures three types of wooden
Q232: <img src="https://d2lvgg3v3hfg70.cloudfront.net/TB8253/.jpg" alt=" A)-0.398 B)-0.916 C)-2.513
Q361: The final grade for an algebra course
Q420: <img src="https://d2lvgg3v3hfg70.cloudfront.net/TB8253/.jpg" alt=" A)x = 1,