SCENARIO 15-4 The superintendent of a school district wanted to predict the percentage of students passing a sixth-grade proficiency test.She obtained the data on percentage of students passing the proficiency test (% Passing), daily mean of the percentage of students attending class (% Attendance), mean teacher salary in dollars (Salaries), and instructional spending per pupil in dollars (Spending)of 47 schools in the state. Let Y = % Passing as the dependent variable,  Attendance,
  Salaries and
  Spending. The coefficient of multiple determination (
  )of each of the 3 predictors with all the other remaining predictors are, respectively, 0.0338, 0.4669, and 0.4743. The output from the best-subset regressions is given below:
 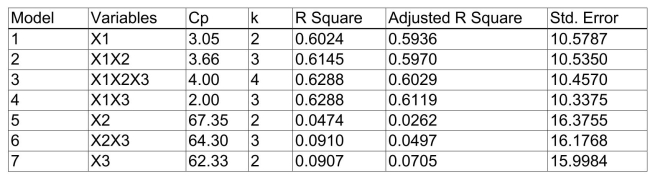 Following is the residual plot for % Attendance:
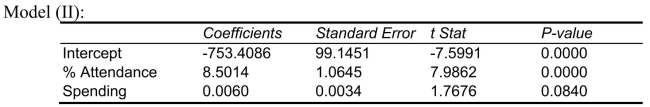
 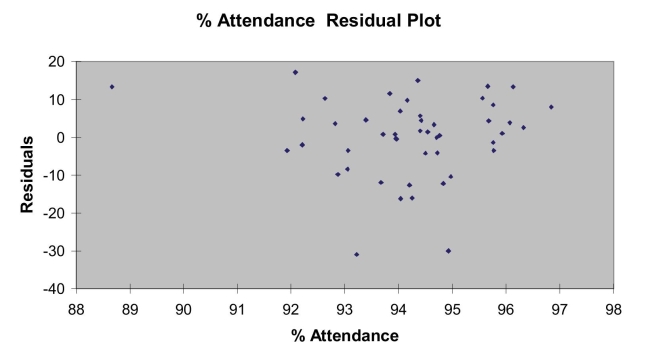 Following is the output of several multiple regression models:
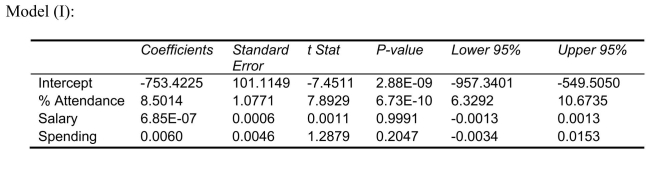
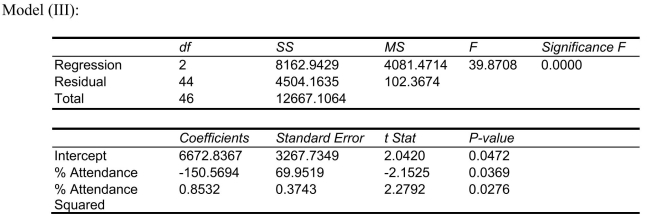
-Referring to Scenario 15-4, the null hypothesis should be rejected when testing whether the quadratic effect of daily average of the percentage of students attending class on percentage of students passing the proficiency test is significant at a 5% level of significance.
Definitions:
Feeler Gauge
A tool made of thin metal strips of varying thicknesses used to measure gap widths, such as in spark plug gaps.
Clearances
The space or gap between two parts, typically measured to ensure proper fit, alignment, or function.
Warpage
Distortion or deformation of a material or component, often caused by uneven heating, cooling, or stress.
Bonds
Financial instruments representing a loan made by an investor to a borrower, often a corporation or government, which pays interest over time and returns the principal at maturity.
Q42: The logarithm transformation can be used<br>A)to overcome
Q44: In nonmetric multidimensional scaling, the distance between
Q77: With four independent variables in a proposed
Q84: Referring to Scenario 14-1, if an employee
Q85: In stepwise regression, an independent variable is
Q122: A quality control engineer is in charge
Q134: Referring to Scenario 13-9, the value of
Q156: Referring to Scenario 16-1, does there appear
Q205: Referring to Scenario 14-8, the coefficient of
Q325: Referring to Scenario 14-3, to test for