SCENARIO 18-10 Given below are results from the regression analysis where the dependent variable is the number of weeks a worker is unemployed due to a layoff (Unemploy)and the independent variables are the age of the worker (Age), the number of years of education received (Edu), the number of years at the previous job (Job Yr), a dummy variable for marital status (Married: 1 = married, 0 = otherwise), a dummy variable for head of household (Head: 1 = yes, 0 = no)and a dummy variable for management position (Manager: 1 = yes, 0 = no).We shall call this Model 1.The coefficient of partial determination  of each of the 6 predictors are, respectively, 0.2807, 0.0386, 0.0317, 0.0141, 0.0958, and 0.1201.
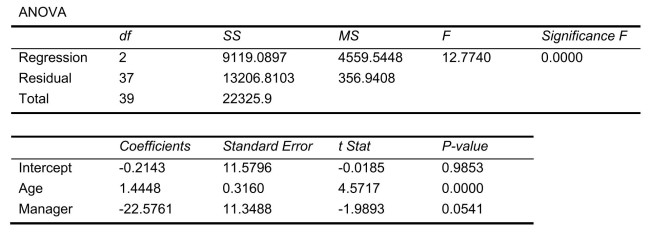
 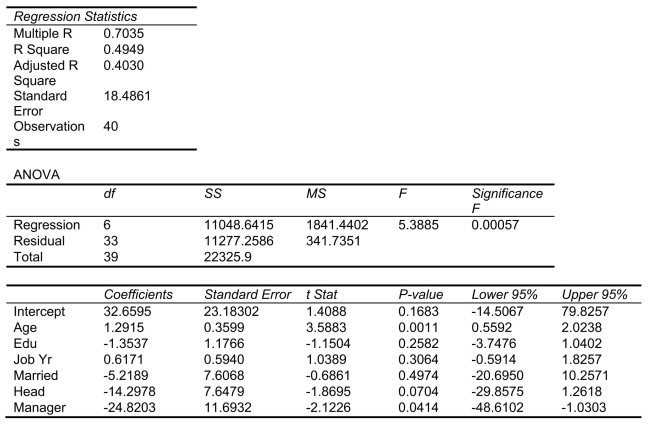 Model 2 is the regression analysis where the dependent variable is Unemploy and the independent variables are Age and Manager.The results of the regression analysis are given below:
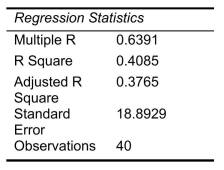
-Referring to Scenario 18-10 and using both Model 1 and Model 2, the null hypothesis for testing whether the independent variables that are not significant individually are also not significant as a group in explaining the variation in the dependent variable should be rejected at a 5% level of significance?
Definitions:
Gross Profit
a company's revenue minus its cost of goods sold, representing the profit a company makes after deducting the costs associated with making and selling its products.
Contribution Margin
The amount of money a product's sales generate over its variable costs, used to cover fixed costs and contribute to net profit.
Net Profit
The financial gain remaining after all expenses, taxes, and costs have been subtracted from total revenue.
Industrial Advertising
Advertising aimed at individuals and organizations who purchase products for manufacturing or reselling other products.
Q21: Single linkage can be used to measure
Q50: Referring to Scenario 18-8, the alternative hypothesis
Q74: Referring to Scenario 17-4, the highest mean
Q82: Referring to Scenario 17-2, the North America
Q103: Referring to Scenario 19-7, what is the
Q129: A company that manufactures designer jeans is
Q234: Referring to Scenario 18-10 Model 1, what
Q273: Data on the amount of money made
Q315: Referring to Scenario 18-10 Model 1, what
Q328: Referring to Scenario 18-6, which of the