SCENARIO 18-8 The superintendent of a school district wanted to predict the percentage of students passing a sixth-grade proficiency test.She obtained the data on percentage of students passing the proficiency test (% Passing) , daily mean of the percentage of students attending class (% Attendance) , mean teacher salary in dollars (Salaries) , and instructional spending per pupil in dollars (Spending) of 47 schools in the state. Following is the multiple regression output with  as the dependent variable,
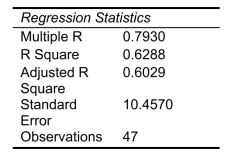
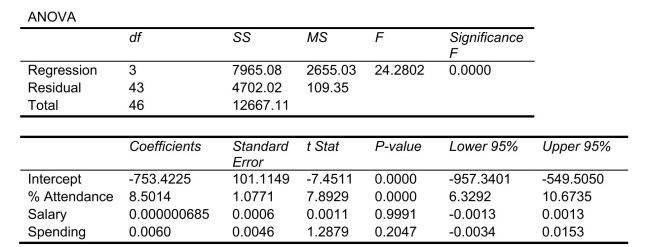
-Referring to Scenario 18-8, which of the following is a correct statement?
Definitions:
Opposite Sex
A term typically used to refer to individuals of the gender different from oneself, often in the context of sexual or romantic attraction.
Sexual Partners
Individuals with whom one engages in sexual activities, within varied contexts ranging from casual encounters to long-term relationships.
Gender Identity
An individual's personal sense of their own gender, which may or may not correspond with the sex assigned at birth.
Biological
Pertaining to the science of life or living organisms, including their structure, function, growth, evolution, and distribution.
Q2: The Cp index measures the potential of
Q42: Referring to Scenario 19-8, an <img src="https://d2lvgg3v3hfg70.cloudfront.net/TB8562/.jpg"
Q42: Referring to Scenario 16-4, exponential smoothing with
Q56: Referring to Scenario 16-12, the best interpretation
Q85: Which of the following terms describes the
Q111: Referring to Scenario 18-8, predict the percentage
Q115: Referring to Scenario 17-7, the "complete" method
Q117: Referring to Scenario 20-6, what is the
Q155: A certain type of rare gem serves
Q161: Referring to Scenario 16-4, a centered 3-year