SCENARIO 19-3 A quality control analyst for a light bulb manufacturer is concerned that the time it takes to produce a batch of light bulbs is too erratic.Accordingly, the analyst randomly surveys 10 production periods each day for 14 days and records the sample mean and range for each day. 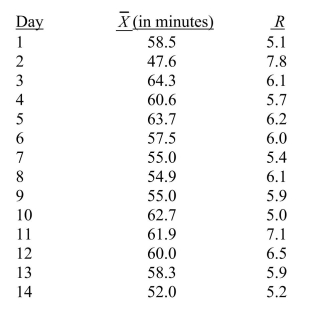
-Referring to Scenario 19-3, suppose the analyst constructs an  chart to see if the production process is in-control.Which expression best describes this chart?
Definitions:
HIV
Human Immunodeficiency Virus, a virus that attacks the immune system and can lead to Acquired Immunodeficiency Syndrome (AIDS) if not treated.
Density Curve
A smooth curve used in statistics to describe the distribution of data where the area under the curve corresponds to the probability of occurrences within a range.
Continuous Random Variables
Variables that can assume an infinite number of values within a given range.
Independent Events
Two or more events that have no influence on each other's occurrence, so that the probability of one event does not change the probability of another.
Q16: A company that manufactures designer jeans is
Q17: Referring to Scenario 20-4, what is the
Q75: The smaller the capability index, the more
Q79: Referring to Scenario 18-10 and using both
Q89: Referring to Scenario 18-1, one individual in
Q101: Referring to Scenario 19-7, an R chart
Q103: Referring to Scenario 18-12, there is not
Q105: Referring to Scenario 20-5, what is the
Q281: If a 95% confidence interval for a
Q312: Referring to Scenario 18-10 and using both