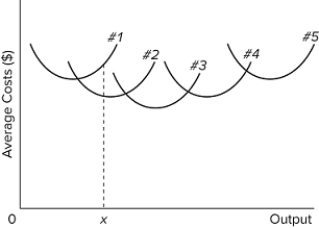
 The diagram shows the short-run average total cost curves for five different plant sizes of a firm. If in the long run the firm should produce output 0 x, it should do it with a plant of size
Definitions:
Fixed Cost
Expenses that do not change with the level of goods or services produced by a business, such as rent, salaries, and insurance.
Variable
An element, feature, or factor that is liable to vary or change, often used in the context of experiments or mathematical models.
Output
The total amount of goods and services produced by an economy, company, or sector.
AVC
Average Variable Cost is the total variable costs divided by the quantity of output produced, representing the variable cost per unit of output.
Q24: The table shows three short-run cost schedules
Q47: Over the range of positive, but diminishing,
Q56: In anonymous surveys, on average people rate
Q100: The table shows the total utility data
Q115: Which of the following is not a
Q159: Which statement best illustrates the law of
Q228: The following table shows the short-run total
Q263: Solar City helped homeowners overcome their myopia
Q285: Plant sizes get larger as you move
Q367: Answer the question on the basis of