
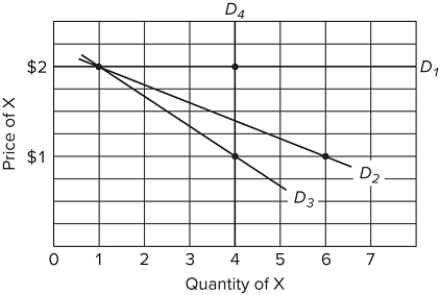
 Refer to the table and graph. Suppose that the price of X falls from $2 to $1, while the price of Y remains at $4. Which of the following represents the demand curve for X if the consumer has money income of $10 to spend on X and Y?
Definitions:
Collusion
An agreement among firms in a market about quantities to produce or prices to charge
Clayton Act
A U.S. antitrust legislation enacted in 1914, aimed at promoting competition and preventing unfair business practices.
Treble Damages
A legal remedy that allows a court to triple the amount of the actual/compensatory damages to be awarded to a complainant.
Cooperation
A process where groups of individuals or organizations work together to achieve mutual benefits or common goals.
Q22: A consumer is making purchases of products
Q37: Answer the question on the basis of
Q100: The table shows the total utility data
Q141: <img src="https://d2lvgg3v3hfg70.cloudfront.net/TB8602/.jpg" alt=" Refer to the
Q204: <img src="https://d2lvgg3v3hfg70.cloudfront.net/TB8602/.jpg" alt=" Given the indifference
Q214: <img src="https://d2lvgg3v3hfg70.cloudfront.net/TB8602/.jpg" alt=" Refer to the
Q225: We would expect the income elasticity of
Q270: Behavioral economics assumes that people are<br>A)eager and
Q273: "Loss aversion" helps explain why people buy
Q351: <img src="https://d2lvgg3v3hfg70.cloudfront.net/TB8602/.jpg" alt=" Given the indifference