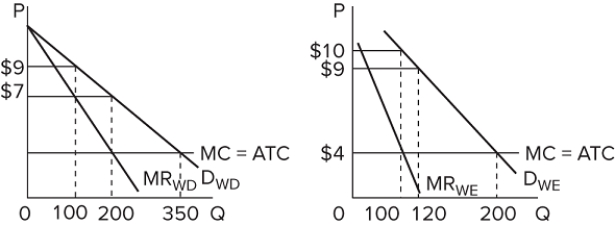
 The graphs represent the demand for use of a local golf course for which there is no significant competition. (It has a local monopoly.) P denotes the price of a round of golf, and Q is the quantity of rounds "sold" each day. If the left graph represents the demand during weekdays and the right graph the weekend demand, this profit-maximizing golf course should
Definitions:
Q69: Marginal revenue is the addition to total
Q81: <img src="https://d2lvgg3v3hfg70.cloudfront.net/TB8602/.jpg" alt=" Refer to the
Q106: <img src="https://d2lvgg3v3hfg70.cloudfront.net/TB8602/.jpg" alt=" Refer to the
Q112: <img src="https://d2lvgg3v3hfg70.cloudfront.net/TB8602/.jpg" alt=" The table gives
Q122: <img src="https://d2lvgg3v3hfg70.cloudfront.net/TB8602/.jpg" alt=" Refer to the
Q137: In the context of analyzing economic efficiency,
Q167: Which of the following statements is correct?<br>A)The
Q190: The fact that the life expectancy of
Q233: One argument for having the government regulate
Q326: Network effects and simultaneous consumption tend to