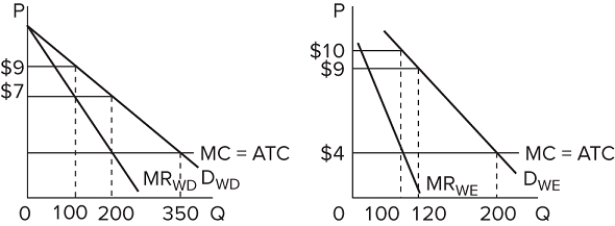
 The graphs represent the demand for use of a local golf course for which there is no significant competition. (It has a local monopoly.) P denotes the price of a round of golf, and Q is the quantity of rounds "sold" each day. If the left graph represents the demand during weekdays and the right graph the weekend demand, this profit-maximizing golf course will earn how much economic profit over the course of a full seven-day week?
Definitions:
Q6: Suppose that a monopolist calculates that at
Q44: A monopolist, being the sole seller in
Q66: <img src="https://d2lvgg3v3hfg70.cloudfront.net/TB8602/.jpg" alt=" If the profit-maximizing
Q87: <img src="https://d2lvgg3v3hfg70.cloudfront.net/TB8602/.jpg" alt=" Refer to the
Q90: The supply curve for a monopolist is
Q98: <img src="https://d2lvgg3v3hfg70.cloudfront.net/TB8602/.jpg" alt=" Refer to the
Q114: When a competitive firm sees losses because
Q120: Which of the following forces does not
Q211: <img src="https://d2lvgg3v3hfg70.cloudfront.net/TB8602/.jpg" alt=" The accompanying graph
Q217: The costs of competition's creative destruction are