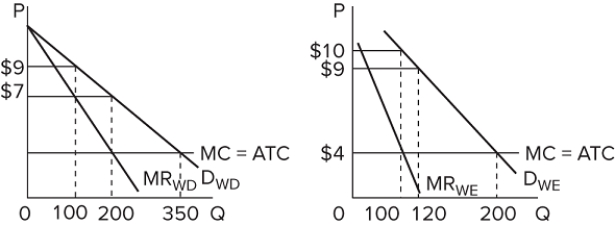
 The graphs represent the demand for use of a local golf course for which there is no significant competition. (It has a local monopoly.) P denotes the price of a round of golf, and Q is the quantity of rounds "sold" each day. If the left graph represents the demand during weekdays and the right graph the weekend demand, this profit-maximizing golf course should
Definitions:
Big Data
Refers to extremely large data sets that may be analyzed computationally to reveal patterns, trends, and associations, especially relating to human behavior and interactions.
Price Discriminate
A pricing strategy where identical or substantially similar goods or services are sold at different prices to different customers.
Personalized Pricing
A pricing strategy where prices are set for individual customers based on their perceived willingness to pay, often using data analytics.
Barriers to Entry
Factors that prevent or impede the ability of a new competitor to enter and operate in an industry.
Q1: The nondiscriminating monopolist's demand curve<br>A)is less elastic
Q8: Price discrimination is illegal in the United
Q21: What are types of firms that exemplify
Q81: Assume that the short-run cost and demand
Q141: What are the major barriers to entry
Q169: <img src="https://d2lvgg3v3hfg70.cloudfront.net/TB8602/.jpg" alt=" Assume a pure
Q185: Which of the following is not an
Q187: Answer the question on the basis of
Q256: <img src="https://d2lvgg3v3hfg70.cloudfront.net/TB8602/.jpg" alt=" Refer to the
Q347: If a nondiscriminating imperfectly competitive firm is