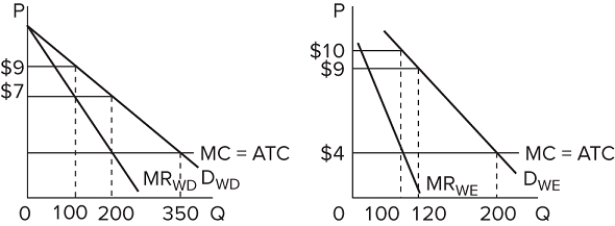
 The graphs represent the demand for use of a local golf course for which there is no significant competition. (It has a local monopoly.) P denotes the price of a round of golf, and Q is the quantity of rounds "sold" each day. If the left graph represents the demand during weekdays and the right graph the weekend demand, this profit-maximizing golf course will earn how much economic profit over the course of a full seven-day week?
Definitions:
Substitutes
Goods or services that can be used in place of each other, where an increase in the price of one leads to an increase in demand for the other.
Elastic
A characteristic of demand or supply where the quantity demanded or supplied responds significantly to price changes.
Imperfect Competition
A market structure characterized by a few sellers or buyers, creating an environment where the entities do not have to accept the market price and can influence it instead.
Inefficiency
The situation where resources are not used in the best possible way or when an economy or process could achieve more output without changing input levels.
Q5: Which of the following is incorrect? Imperfectly
Q13: Long-run adjustments in purely competitive markets primarily
Q27: Suppose an increase in product demand occurs
Q38: Which of the following would not be
Q44: Explain why the economic analysis of monopolistic
Q119: <img src="https://d2lvgg3v3hfg70.cloudfront.net/TB8602/.jpg" alt=" Refer to the
Q152: Under what conditions would an increase in
Q241: The MR = MC rule can be
Q275: If a regulatory commission wants to establish
Q283: <img src="https://d2lvgg3v3hfg70.cloudfront.net/TB8602/.jpg" alt=" Refer to the