Multiple Choice
The diagram below represents the market for butter.
FIGURE 4-1
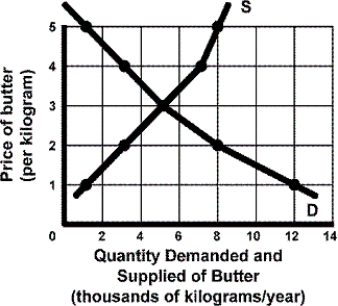
-Refer to Figure 4-1. What is the equilibrium price of butter?
Definitions:
Related Questions
Q2: Refer to Figure 3-5. What does a
Q10: When the price of corn falls, the
Q28: What knowledge about opportunity costs is important
Q40: Which one of the following will cause
Q64: Refer to Figure 3-3. The University Theatre
Q68: Ceteris paribus, if the market demand for
Q77: What is the opportunity cost of attending
Q86: A decrease in wages will increase the
Q153: Lumber prices fall in Calgary, Alberta, because
Q157: Which of the following best demonstrates marginal