Multiple Choice
FIGURE 5-3
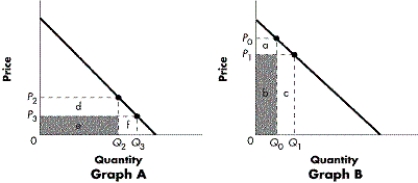
-Refer to Figure 5-3. Elasticity varies along a linear demand curve. What does Graph A represent?
Definitions:
Related Questions
Q10: Price elasticity of demand is a measure
Q15: What does the imposition of a price
Q23: Which of the following is most likely
Q47: Which of the following will most likely
Q55: In the long run, firms can vary
Q63: Refer to Figure 4-3. Starting with initial
Q71: What relationship does a production function show?<br>A)
Q100: Which action will always result in a
Q115: As the market price of a good
Q143: What will a shift in the supply