Multiple Choice
FIGURE 7-2
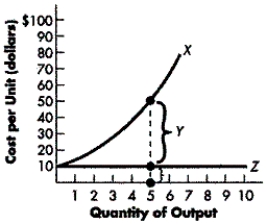
-Refer to Figure 7-2. The diagram above shows two cost curves representing short-run total cost and total fixed cost. Which letter represents the total cost curve and the total fixed cost curve?
Identify methods to manage accounts receivable and inventory to improve cash flow.
Analyze the effects of financing decisions on business risk and return.
Learn the implications of not taking discounts on trade credit.
Understand the practical application of financing concepts in seasonal businesses and the overall effect on the company's financial structure.
Definitions:
Related Questions
Q9: What quantity will a monopolist operate at?<br>A)
Q10: What does average cost regulation of a
Q17: In order to reach consumer equilibrium, how
Q38: With knowledge about the direction (but not
Q67: Refer to Figure 5-2. With reference to
Q69: Which of the following best describes the
Q96: Refer to Table 8-2. If input costs
Q101: Negative externalities lead to an underallocation of
Q110: The nation's largest cable TV company tested
Q114: Refer to Figure 4-4. Starting with initial