This figure shows the long-run average total cost curve for a firm that produces basketballs, along with four short-run average total cost curves. Each of the short-run average total cost curves corresponds to a different plant size. SRATC₁ corresponds to Plant size 1, SRATC₂ corresponds to Plant size 2, and so forth.
FIGURE 7-5
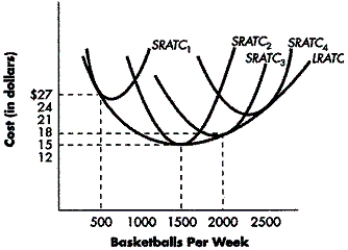
-Refer to Figure 7-5. Which plant is optimal if the firm is going to produce 500 basketballs per week?
Definitions:
Elastic Demand
Describes a market condition in which the demand for a product is sensitive to price changes.
Target Costing
A pricing strategy in which the selling price and profit margin are used to determine the maximum cost that can be incurred on a product, with the aim of ensuring competitiveness and profitability.
Target Profit
The specific net income a business intends to reach within a designated timeframe.
Price Elasticity of Demand
A measure of how much the quantity demanded of a good responds to a change in the price of that good.
Q6: When a 9 percent increase in price
Q16: Refer to Figure 9-1. What area indicates
Q17: Which of the following does NOT describe
Q53: If makers of snake anti-venom implement significant
Q60: A natural monopoly exists when one large
Q77: The profit-maximizing firm illustrated Figure 10-2 operates
Q87: If a consumer's total expenditure on a
Q127: Refer to Table 4-3. What is the
Q149: Refer to Table 6-6. The table gives
Q151: Refer to Figure 7-4. At output level