This figure shows the long-run average total cost curve for a firm that produces basketballs, along with four short-run average total cost curves. Each of the short-run average total cost curves corresponds to a different plant size. SRATC₁ corresponds to Plant size 1, SRATC₂ corresponds to Plant size 2, and so forth.
FIGURE 7-5
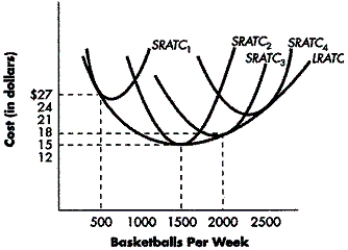
-Refer to Figure 7-5. What is the total cost of producing 1500 basketballs per week, assuming the firm uses the optimal plant size?
Definitions:
Materials Price Variance
Difference between the actual cost of material and the standard cost multiplied by the amount of material purchased.
Cash Account
An account reflecting the amount of cash a company or individual has available.
Work in Process Inventory
Items that are partially completed during manufacturing, which are not yet ready for sale.
Direct Labor Costs
Costs that can be directly attributed to the production of goods or services, such as wages paid to workers manufacturing a product.
Q11: The market demand curve in a perfectly
Q19: What can we conclude the greater the
Q21: Which of the following is an explicit
Q25: If the short-run average total cost curve
Q28: What type of costs are involved when
Q39: Refer to Figure 7-4. At output level
Q51: Which of the following contributes to the
Q52: Which of the following best illustrates the
Q56: A monopolistically competitive firm will maximize profits
Q122: "I'm losing money, but since my fixed