This figure shows the long-run average total cost curve for a firm that produces basketballs, along with four short-run average total cost curves. Each of the short-run average total cost curves corresponds to a different plant size. SRATC₁ corresponds to Plant size 1, SRATC₂ corresponds to Plant size 2, and so forth.
FIGURE 7-5
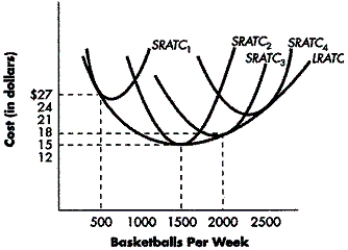
-Refer to Figure 7-5. Which plant size is optimal for the firm to produce 1500 basketballs each week?
Definitions:
Trading
The act of buying, selling, or exchanging goods, services, or financial instruments within markets.
Loads
In finance, refers to fees or commissions charged by a mutual fund, which can be at the time of purchase (front-end load), time of sale (back-end load), or as an annual expense (level load).
Absolute Advantage
The ability of a party (country, company, individual) to produce a greater quantity of a good, product, or service than competitors using the same amount of resources.
Comparative Advantage
The ability of an individual, firm, or country to produce a good or service at a lower opportunity cost than competitors, leading to more efficient trade possibilities.
Q13: Refer to Figure 9-3. If the government
Q27: If the supply curve is perfectly elastic,
Q32: What is the shape of the long-run
Q45: Which of the following is a key
Q63: Economists define the long run as any
Q66: Diseconomies of scale are present when the
Q72: Total cost equals total variable cost plus
Q92: If a firm produces in the short
Q113: Ray Tucker has run his company, Tucker's
Q132: Which of the following best describes production