This figure shows the long-run average total cost curve for a firm that produces basketballs, along with four short-run average total cost curves. Each of the short-run average total cost curves corresponds to a different plant size. SRATC₁ corresponds to Plant size 1, SRATC₂ corresponds to Plant size 2, and so forth.
FIGURE 7-6
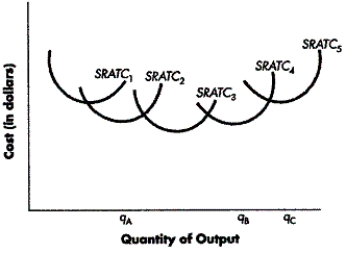
-Refer to Figure 7-6. Which plant size is optimal for the firm to produce qB units of output each week?
Definitions:
Customer's Interests
Preferences, needs, or desires that customers seek to fulfill when purchasing goods or services.
Ethical Decisions
Choices made based on moral principles and values, often involving considerations of fairness, accountability, and integrity.
Job Enlargement
The grouping of a variety of tasks about the same skill level; horizontal enlargement.
Source Inspection
The practice of inspecting goods or materials at the supplier's site before they are shipped to the purchaser, to ensure they meet specified quality standards.
Q4: Refer to Figure 9-4. What price would
Q24: What can we conclude about a competitive
Q26: Which of the following best describes a
Q44: Complete the chart below for a firm
Q55: In the long run, firms can vary
Q62: Refer to Figure 5-3. How would price
Q82: Why do oligopolists tend to change their
Q106: Which of the following is NOT an
Q107: As the price of DVD players has
Q139: When making a decision between purchasing two