FIGURE 8-2
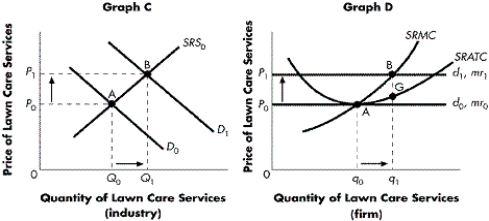
-Refer to Figure 8-2. As a result of the change illustrated by Graph C, what is the individual firm now experiencing in Graph D?
Definitions:
Marginal Revenue
Income gained by selling an additional unit of a product or service.
Marginal Cost
The increased expenditure incurred from producing one more unit of a product or service.
Demand Curve
A visual diagram that illustrates how the quantity of a product demanded by buyers correlates with its price.
Marginal Revenue Curve
A graphical representation showing the additional income generated from the sale of one more unit of a good or service.
Q4: Refer to Figure 9-4. What price would
Q6: When a profit-maximizing firm makes a decision
Q7: Refer to Table 6-5. The table shows
Q28: If the price elasticity of demand coefficient
Q96: Under what circumstances might advertising benefit society?<br>A)
Q98: If the production of a particular good
Q102: What effect will the entry of new
Q106: When the price of ulcer medication increased
Q115: If there is an increase in productivity
Q154: Darlene runs a fruit and vegetable stand