Figure 8-10
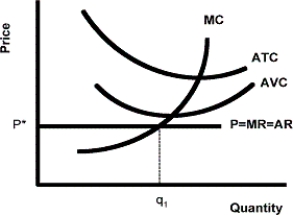
-The graph above represents a price-taking firm producing q₁ units of output. Is the firm making a profit, experiencing a loss, or earning a normal profit? Should the firm increase output, decrease output, or shut down? Explain.
Definitions:
Points-Of-Difference
Unique attributes or benefits of a product, service, or brand that set it apart from its competitors in the eyes of the target market.
CVP
Stands for Cost-Volume-Profit analysis, a tool used by businesses to determine how changes in costs and volume affect a company's operating income and net income.
All-Benefits
A type of value proposition that involves identifying and promoting all the benefits of a product or service to customer segments, with little regard for the competition or any real insight into what the customer really wants or needs.
Suppliers
Entities that provide goods or services to other entities, typically within a supply chain or business context.
Q2: Which of the following is NOT one
Q48: When does diminishing marginal product of labour
Q79: The law of diminishing marginal product provides
Q80: What is the term for the lowest
Q93: In the absence of government action, why
Q98: If the production of a particular good
Q113: In what way are a price-taking firm
Q128: Refer to Figure 6-2. Currently Q₀ of
Q145: Refer to Figure 8-4. What does Graph
Q152: It is sometimes argued that the lack