Multiple Choice
The following diagram contains information on cost and revenue curves facing a regulated monopoly.
FIGURE 9-3
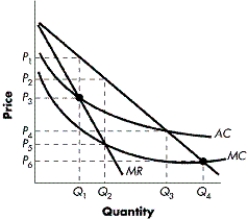
-Refer to Figure 9-3. If the government is able to regulate the monopolist using average-cost pricing, what price and output combinations are expected to result?
Definitions:
Related Questions
Q16: Which of the following can contribute to
Q31: In many communities across the country it
Q52: Why does the consumer surplus lost, because
Q58: What is the most socially efficient market
Q78: When economists use game theory to analyze
Q81: The period of time that is too
Q96: Refer to Table 8-2. If input costs
Q115: If there is an increase in productivity
Q122: What is the satisfaction that Sheldon gets
Q144: Refer to Table 9-3. What are the