The following diagram contains information on cost and revenue curves facing a regulated monopoly.
FIGURE 9-3
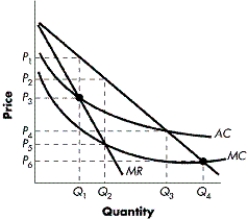
-Refer to Figure 9-3. If the government is able to regulate the monopolist using marginal-cost pricing, what price and output combinations are expected to result?
Definitions:
Labor
Utilizing human physical and mental prowess in the production and servicing of goods.
MRP
The marginal revenue product, which is the additional revenue generated from using one more unit of a factor of production.
Wage Rate
The amount of money paid to an employee per unit of time or for each unit of output produced.
Demand Schedule
A table or graph that shows the quantity of a good or service that consumers wish to buy at each price level.
Q1: Which of the following is more likely
Q2: What are the most common causes of
Q43: If price is less than the average
Q93: What is an important and often ignored
Q99: Which of the following best describes the
Q100: If labour demand is downward sloping and
Q117: In order to maximize profits, a firm
Q129: Which of the following statements best describes
Q133: When is a natural monopoly likely to
Q142: In a perfectly competitive market, marginal revenue