Multiple Choice
Exhibit 3A-2 Comparison of Market Efficiency and Deadweight Loss 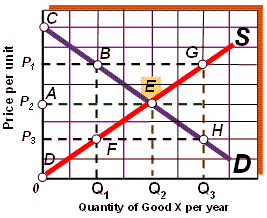 As shown in Exhibit 3A-2, if the quantity supplied of good X per year is Q3, the result is:
Definitions:
Related Questions
Q18: The slope of a line parallel to
Q19: Exhibit 4-3 Supply and demand curves <img
Q29: Exhibit 4-5 Supply and demand curves for
Q32: If Congress decides to reduce the tax
Q33: Microeconomics is the branch of economics in
Q45: In economics, the term "surplus" means an
Q68: Money is one of our nation's resources
Q128: If consumer incomes go up and Harley
Q131: Assuming that shoe repair services are an
Q158: A rightward (an outward)shift of a nation's