Exhibit 3-3 Demand curves 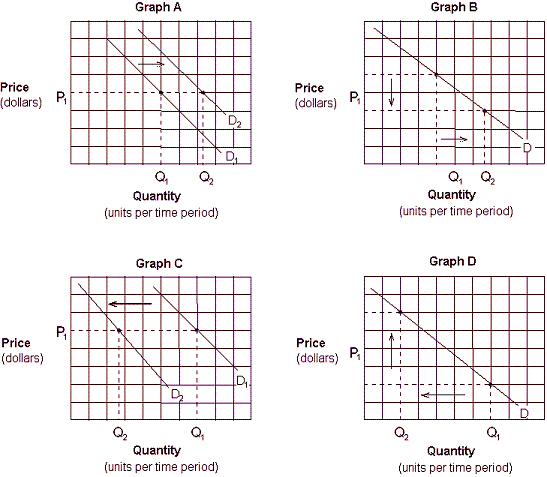 Which of the graphs in Exhibit 3-3 depicts the effect of a decrease in the price of domestic cars on the demand for foreign cars?
Definitions:
Zone of Tolerance
The range within which customers are willing to accept variations in service delivery and quality.
Voice-of-customer Quotient
A metric or approach that measures the extent to which a company's products or services align with the expectations and needs of its customers.
Service Providers
Companies or individuals that offer services to others in exchange for compensation, often in sectors like telecommunications, health, or education.
Good Job
An expression of approval or praise for someone's accomplishment or performance.
Q21: Direct relationships are illustrated using upward-sloping lines
Q21: Exhibit 4-9 Data on supply and demand
Q24: A competitive market economy is unlikely to
Q73: The various combinations of goods and services
Q80: An analysis of production possibilities curves indicates
Q102: The law of increasing costs indicates that
Q161: When there are positive externalities associated with
Q166: A price floor would be established in
Q210: Gross domestic product (GDP)includes:<br>A)intermediate as well as
Q304: Assuming steak and potatoes are complements, other