Exhibit 4-11 Data on supply and demand 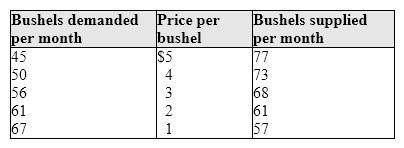 Which of the following would occur if the government imposed a price floor (support price) of $4 per bushel in the wheat market shown in Exhibit 4-11?
Definitions:
Marginal Utility
The change in total utility a person receives from consuming an additional unit of a good or service.
Utility Function
A mathematical representation that ranks an individual's preferences over a set of goods and services, based on the level of satisfaction or utility derived.
Optimal Utility Rule
A principle in consumer theory stating that consumers allocate their income in a way that maximizes their total utility, given their budget constraint.
Indifference Curve
A graph representing combinations of goods or services among which a consumer is indifferent, showing the same level of utility for each point along the curve.
Q27: A discouraged worker is one who:<br>A)is underqualified
Q34: Deadweight loss results from too few or
Q35: Exhibit 5-4 Gross domestic product data<br><img src="https://d2lvgg3v3hfg70.cloudfront.net/TBX9027/.jpg"
Q41: Exhibit 4-10 Supply and demand data for
Q64: Exhibit 4-9 Data on supply and demand<br><img
Q79: Exhibit 5-11 GDP data (billions of dollars)
Q92: An individual who is employed part time,
Q118: Personal income minus personal taxes equals disposable
Q209: In the presence of positive externalities, a
Q214: If the demand curve increases while the