Exhibit 17-2 Aggregate demand and aggregate supply curves 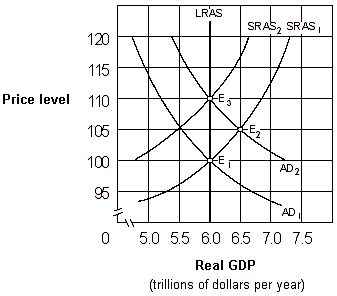 As shown in Exhibit 17-2, if people behave according to rational expectations theory, an increase in the aggregate demand curve from AD1 to AD2 will cause the price level to move:
Definitions:
On-The-Job Training
A method of learning skills and competencies required for a job through direct performance during work hours.
Negative Income Tax
A welfare system within which individuals earning below a certain amount receive supplemental pay from the government instead of paying taxes.
Income Distribution
Income distribution is the way in which total income is shared among the population of a country or region.
Progressive Tax Rates
A tax system where the tax rate increases as the taxable amount or income increases, imposing a higher percentage rate on higher income earners.
Q8: Which of the following would cause the
Q15: Exhibit 16A-3 Macro AD\AS Models <img src="https://d2lvgg3v3hfg70.cloudfront.net/TBX9027/.jpg"
Q55: Which of the following statements is true
Q77: If national real GDP grows at twice
Q94: Since the 1970s, the Phillips curve has:<br>A)remained
Q97: If the Federal Reserve wishes to increase
Q106: The theory of comparative advantage suggests that
Q135: If the Fed uses its tools to
Q144: The number of times per year each
Q149: People learn to hold a specific quantity