Exhibit 17-3 Aggregate demand and aggregate supply curves 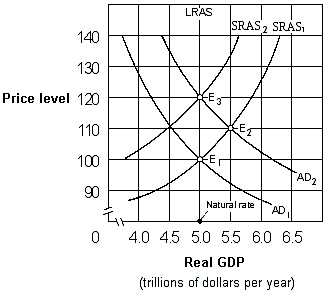 As shown in Exhibit 17-3, if people behave according to adaptive expectations theory, an increase in the aggregate demand curve from AD1 to AD2 will cause the price level to move:
Definitions:
Q4: Which of the following is a characteristic
Q5: A decrease in the supply of money,
Q25: Exhibit 16-3 Money market demand and supply
Q39: Exhibit 15-6 Dollars per British pound<br><img src="https://d2lvgg3v3hfg70.cloudfront.net/TBX9027/.jpg"
Q48: A country's balance on current account will
Q75: The required reserve ratio is required reserves
Q83: If Dana can paint his house faster
Q99: On a Phillips curve diagram, an increase
Q168: The Monetarists advocate the monetary rule in
Q187: Investment is lowered by expansionary monetary policy.