Exhibit 17-2 Aggregate demand and aggregate supply curves 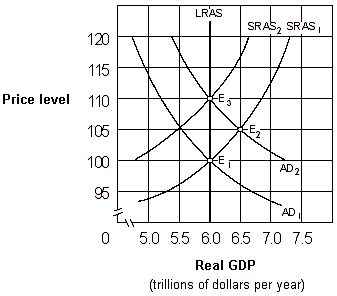 As shown in Exhibit 17-2, if people behave according to rational expectations theory, an increase in the aggregate demand curve from AD1 to AD2 will cause the price level to move:
Definitions:
Variable Expenses
Costs that vary in direct proportion to changes in an organization's activity level or volume of output.
Operating Leverage
A measure of how sensitive net operating income is to a given percentage change in dollar sales.
Net Income
The total profit of a company after all expenses and taxes have been subtracted from total revenue.
Contribution Margin
The difference between sales revenue and variable costs, indicating the contribution of sales to fixed costs and profits.
Q6: A decrease in the money supply:<br>A)lowers the
Q27: An economic system that answers the What
Q36: Which of the following is not a
Q37: In a market economy:<br>A)collective decision-making is more
Q69: The stock of money people hold to
Q95: Exhibit 15-3 Balance sheet of Tucker National
Q98: If the economy is inflationary, the Fed
Q104: Adam Smith wrote that the:<br>A)economic problems of
Q133: An open-market purchase by the Federal Reserve
Q191: Suppose rice can be produced in country