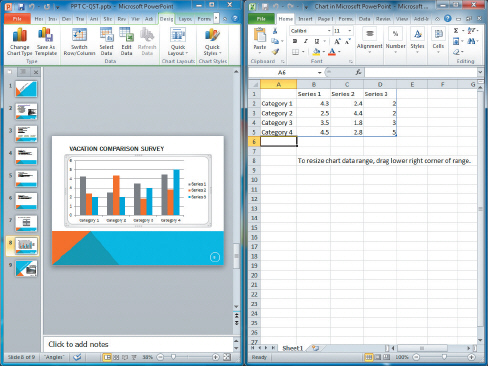
 The chart shown in the figure above is a ____ chart.
Definitions:
Level of Significance
The probability of rejecting the null hypothesis when it is actually true, used as a threshold in hypothesis testing.
Test Statistic
A calculated value from a data sample used to test a hypothesis against some criteria.
P-Value
The probability of observing a statistical summary at least as extreme as the one observed if the null hypothesis is true.
Sample Mean
The average of a set of numerical values taken from a larger population, used as an estimate of the population mean.
Q26: The Design styles are organized into sections;
Q37: <img src="https://d2lvgg3v3hfg70.cloudfront.net/TBX9080/.jpg" alt=" When
Q45: The _ service available via Windows Live
Q46: Text in a SmartArt graphic can be
Q53: There are two ways to add a
Q55: To broadcast a presentation, click the Broadcast
Q69: Master text and content placeholders have three
Q76: A new colleague of yours has been
Q112: The _ shortcut keys remove character formatting.<br>A)CONTROL-0
Q137: The default view that PowerPoint opens in