Figure 3-11
The graph below represents the various combinations of ham and cheese (in pounds) that the nation of Bonovia could produce in a given month.
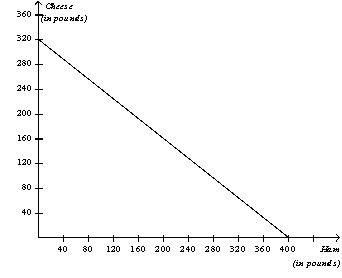
-Refer to Figure 3-11.In the nation of Cropitia,the opportunity cost of a pound of cheese is 1.5 pounds of ham.Based on this information,if Bonovia and Cropitia want to trade,Bonovia should specialize in the production of
Definitions:
Developing Countries
Nations with low to moderate industrialization and lower living standards, often marked by lower levels of income, education, and health care.
Developmental Disabilities
A diverse group of chronic conditions that are due to mental or physical impairments that arise before adulthood.
Caffeine
A stimulant commonly found in coffee, tea, and other beverages, known to affect central nervous system activity.
Tobacco
A plant whose leaves are harvested and processed for smoking, chewing, or snuffing, containing the addictive substance nicotine.
Q138: Refer to Table 3-9.Barb's opportunity cost of
Q164: Differences in opportunity cost allow for gains
Q189: When the price of a good or
Q242: Refer to Table 4-4.Which supply schedules obey
Q419: Refer to Figure 3-3.Arturo has an absolute
Q422: A market supply curve shows how the
Q442: Suppose there are five suppliers of ice
Q443: By definition,imports are<br>A) people who work in
Q468: In the circular-flow diagram,firms own the factors
Q515: Which of the following would not shift