Figure 4-8
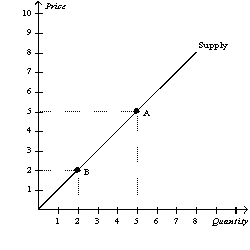
-Refer to Figure 4-8.The movement from Point A to Point B represents a(n)
Definitions:
Own Price Elasticity
Own price elasticity measures the responsiveness of the quantity demanded of a good to a change in its own price.
Market Share
The percentage of an industry's total sales that is earned by a particular company over a specified time period.
Demand
The quantity of a good or service that consumers are willing and able to purchase at various prices during a given period.
Gas Station
A facility where gasoline (petrol) and often other fuels and automotive products are sold to motorists.
Q12: When quantity supplied decreases at every possible
Q110: Refer to Table 4-4.If these are the
Q137: Refer to Figure 3-10.What are Alice and
Q171: If labor in Mexico is less productive
Q201: When a shortage exists in a market,sellers<br>A)
Q260: Refer to Figure 3-8.Chile should specialize in
Q282: Music compact discs are normal goods.What will
Q310: Refer to Table 3-3.Zimbabwe and Portugal would
Q359: Interdependence among individuals and interdependence among nations
Q481: The greater the price elasticity of demand,the<br>A)