Figure 5-9
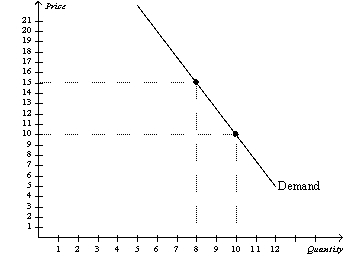
-Refer to Figure 5-9.Suppose this demand curve is a straight,downward-sloping line all the way from the horizontal intercept to the vertical intercept.We choose two prices,P₁ and P₂,and the corresponding quantities demanded,Q₁ and Q₂,for the purpose of calculating the price elasticity of demand.Also suppose P₂ > P₁.In which of the following cases could we possibly find that (i) demand is elastic and (ii) an increase in price from P₁ to P₂ causes an increase in total revenue?
Definitions:
Regional Monopoly
A regional monopoly exists when a single firm dominates the market for a particular good or service in a geographic area.
Herfindahl-Hirschman Index
A measure of market concentration that squares and then sums the market shares of all firms within an industry, indicating the level of competition.
Game Theory
A theoretical framework for conceiving social situations among competing players and for predicting their choices of strategic actions.
Open Collusion
A situation where firms openly agree on prices, production levels, or market shares, violating competition laws.
Q85: When the price of a good is
Q100: If the cross-price elasticity of demand for
Q117: The price elasticity of demand for a
Q122: In response to a shortage caused by
Q150: Minimum-wage laws dictate<br>A) the exact wage that
Q246: For a particular good,a 10 percent increase
Q275: Refer to Figure 6-9.At which price would
Q309: If a tax is levied on the
Q332: Given the market for illegal drugs,when the
Q438: Which of the following statements does not