Figure 5-9
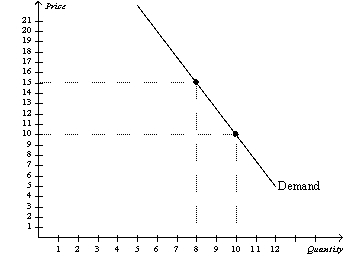
-Refer to Figure 5-9.Suppose this demand curve is a straight,downward-sloping line all the way from the horizontal intercept to the vertical intercept.We choose two prices,P₁ and P₂,and the corresponding quantities demanded,Q₁ and Q₂,for the purpose of calculating the price elasticity of demand.Also suppose P₂ > P₁.In which of the following cases could we possibly find that (i) demand is elastic and (ii) an increase in price from P₁ to P₂ causes an increase in total revenue?
Definitions:
Discount Rate
The rate of interest applied in DCF evaluations to estimate the current worth of future cash inflows.
Net Present Value
The difference between the present value of cash inflows and the present value of cash outflows over a period, used in capital budgeting to assess profitability.
Sales Revenues
The total amount of money generated from sales of goods or services before any expenses are subtracted.
Operating Expenses
Costs related to the day-to-day functioning of a business, excluding the cost of goods sold.
Q3: If an increase in income results in
Q25: Refer to Figure 6-6.If the government imposes
Q197: Refer to Figure 4-21.Which of the following
Q233: Refer to Table 5-1.Which of the following
Q300: Which of the following could be the
Q336: If demand is price inelastic,then when price
Q344: Refer to Figure 4-22.Panel (b)shows which of
Q366: Refer to Table 5-5.Using the midpoint method,at
Q397: It is not possible for demand and
Q496: Years ago,thousands of country music fans risked