Multiple Choice
Figure 8-4
The vertical distance between points A and B represents a tax in the market.
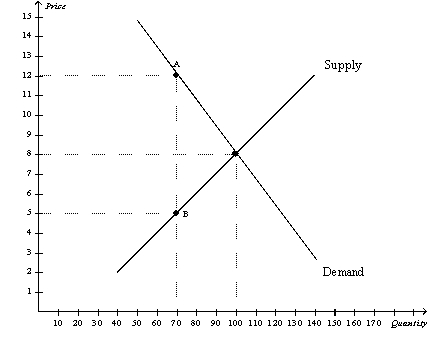
-Refer to Figure 8-4.The tax results in a loss of consumer surplus that amounts to
Definitions:
Related Questions
Q10: If the tax on gasoline increases from
Q51: Refer to Figure 8-2.The loss of producer
Q55: Refer to Figure 8-3.The loss in producer
Q69: The Surgeon General announces that eating chocolate
Q207: Suppose that instead of a supply-demand diagram,you
Q234: Refer to Figure 9-1.When trade in wool
Q314: Refer to Table 7-8.If the sellers bid
Q320: Refer to Figure 8-4.The amount of the
Q391: Refer to Figure 9-1.From the figure it
Q410: When markets fail,public policy can potentially remedy