Multiple Choice
Figure 9-8.On the diagram below,Q represents the quantity of cars and P represents the price of cars. 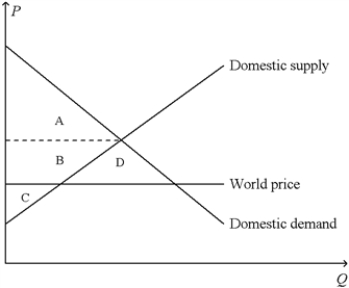
-Refer to Figure 9-8.In the country for which the figure is drawn,total surplus with international trade in cars
Definitions:
Related Questions
Q94: Refer to Figure 8-7.Which of the following
Q134: Which of the following statements is correct?<br>A)
Q135: Refer to Scenario 8-2.If Stephanie hires Tom
Q224: Refer to Figure 9-15.For the saddle market,area
Q228: Tax revenues increase in direct proportion to
Q270: Refer to Figure 10-7.To internalize the externality
Q308: Refer to Scenario 8-1.Assume Erin is required
Q348: The deadweight loss from a tax of
Q364: Suppose a tax of $5 per unit
Q395: When a country abandons a no-trade policy,adopts