Figure 18-4
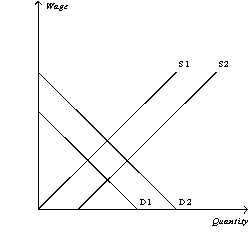
-Refer to Figure 18-4.The graph above illustrates the market for bakers who make homemade breads and breakfast pastries.If bakeries adopt new labor-saving technologies,what happens in the market for bakers?
Definitions:
Interpret
To explain the meaning of information, data, or actions.
Sample Size
The number of observations or data points used in a statistical analysis.
β Value
In statistics, represents the type II error rate, or the probability of failing to reject a false null hypothesis; also used to denote regression coefficients in multiple regression models.
Increasing
Becoming greater or larger in quantity, size, intensity, or degree.
Q43: Suppose that a college physics experiment goes
Q62: Refer to Figure 18-8.Which of the following
Q66: Because a firm's demand for a factor
Q87: Refer to Table 18-4.How many workers should
Q165: Refer to Figure 18-2.Suppose the firm pays
Q226: Refer to Table 17-20.What is the Nash
Q304: The Sherman Antitrust Act prohibits executives of
Q311: Refer to Figure 18-1.Suppose the firm sells
Q380: When a competitive firm maximizes profit,it will
Q387: Refer to Figure 18-1.Suppose the firm sells