Multiple Choice
The following diagram shows one indifference curve representing the preferences for goods X and Y for one consumer. 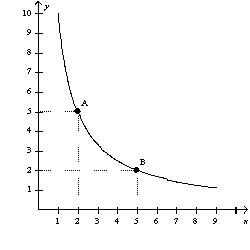
What is the marginal rate of substitution between points A and B?
Apply addition and subtraction operations to algebraic fractions.
Understand how to use beginning, ending, or average values for ratios involving balance sheet figures.
Calculate cash flows from operating, investing, and financing activities.
Develop and interpret a statement of cash flows including reconciliation with the cash account.
Definitions:
Related Questions
Q44: Which of the following is not an
Q70: If the median voter theorem holds,<br>A) a
Q97: Which of the following statements is not
Q108: When indifference curves are downward sloping,the marginal
Q131: Which of the following is an example
Q132: Data for the United States suggests that
Q214: The theory of consumer choice provides the
Q270: The substitution effect in the work-leisure model
Q292: Refer to Figure 21-17.Bundle B represents a
Q416: Refer to Figure 21-13.What is the consumer's