Figure 21-19 The Following Graph Illustrates a Representative Consumer's Preferences for Marshmallows
Figure 21-19
The following graph illustrates a representative consumer's preferences for marshmallows and chocolate chip cookies:
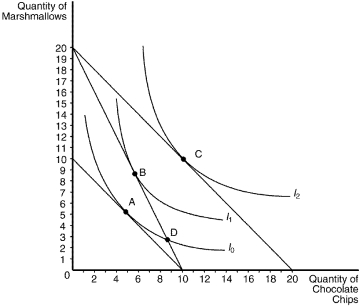
-Refer to Figure 21-19.Assume that the consumer has an income of $40,the price of a bag of marshmallows is $2,and the price of a bag of chocolate chips is $2.The optimizing consumer will choose to purchase which bundle of marshmallows and chocolate chips?
Definitions:
Q28: Refer to Scenario 22-5.If,before any votes were
Q45: Giffen goods have positively-sloped demand curves because
Q45: A radio story reported a study on
Q70: Janet prefers cashews to almonds.She prefers macadamia
Q110: Which of the following statements about the
Q144: In American politics,we often observe that during
Q203: The state of Massachusetts requires all citizens
Q237: Refer to Table 22-15.The median voter is
Q321: Which of the following statements is not
Q337: The goal of libertarianism is to<br>A) redistribute