Figure 21-19 The Following Graph Illustrates a Representative Consumer's Preferences for Marshmallows
Figure 21-19
The following graph illustrates a representative consumer's preferences for marshmallows and chocolate chip cookies:
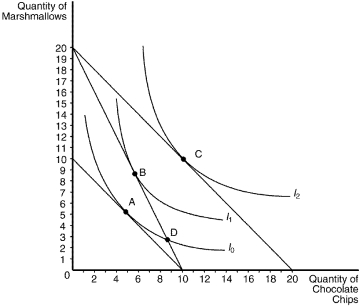
-Refer to Figure 21-19.Assume that the consumer depicted the figure has an income of $50.Based on the information available in the graph,which of the following price-quantity combinations would be on her demand curve for chocolate chips if the price of marshmallows is $2.50?
Definitions:
Q22: Which of the following would be an
Q36: Because people can borrow when they are
Q38: In the United States in 2008,the bottom
Q149: In view of the possible need for
Q220: Refer to Scenario 22-1.The median voter is
Q237: Giffen goods are inferior goods for which
Q258: A decrease in a consumer's income<br>A) increases
Q339: Libertarians believe that<br>A) the government should choose
Q351: When Matt has an income of $2,000,he
Q356: Despite continued growth in average income since