The following graphs show the frequency of the b+ allele over 20 generations in two populations of heterozygous flour beetles (data for a population of 10 individuals is shown in graph A; data for a population of 100 individuals is shown in graph B) . Why does the frequency of the b + allele increase in both populations? 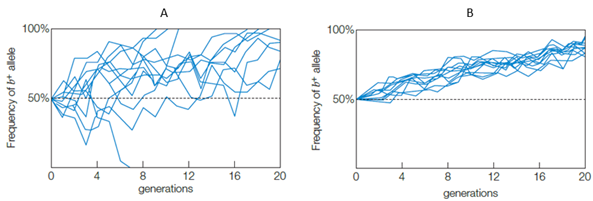
Definitions:
Law of Large Numbers
A statistical principle that states that as a sample size grows, its mean gets closer to the average of the whole population.
Blood Type
A method of classifying blood by examining the presence or lack of certain inherited antigenic substances on red blood cell exteriors.
Joint Frequency Distribution
A statistical representation showing the frequency of occurrences for combinations of two or more categories or variables.
Blood Type B
A blood group classification determined by the presence of antigen B on the surface of red blood cells.
Q6: Which element is a density-dependent factor that
Q23: As the polypeptide is elongating during translation,
Q28: When two alleles of the same gene
Q40: A cell cycle checkpoint at which phase
Q41: The leaves of ferns are called _.<br>A)
Q63: If the <sup>14</sup>C to <sup>12</sup>C ratio present
Q64: Morphological divergence _.<br>A) is the change in
Q72: During S phase, _.<br>A) chromosomes condense<br>B) the
Q73: <img src="https://d2lvgg3v3hfg70.cloudfront.net/TBX8684/.jpg" alt=" In this
Q74: Solenopsis invicta, a species of fire ant,